DevTools is the single best thing that the browsers have to offer to a web designer or developer. Whilst, at the same time, the biggest surprise as a browser feature. In other words, nobody saw it coming, but we all loved it when it arrived. Nowadays, if you refuse to use it, you’ll probably make your life harder. It’s both a very easy way to manipulate HTML and CSS, as well as an advanced tool for inspecting HTTP requests, certificates, debug JavaScript, and more.
Backstory
It all started in 2006 with Firebug. Firebug was the first iteration of what we now refer to as Developer Tools. It acted as a Firefox extension because it started as a separate thing from the browser itself. Nobody knew how big its impact on the community of developers would be. It was created by one of the initial Firefox creators.
This was the first in-browser tool, that allowed developers to manipulate HTML and CSS as you would through a code editor, except you’d do it directly in the browser.
Short Summary of Feature Development
In 2007, just one year later, it was open-sourced and in the same year, it reached its 1.0 stable version. In 2009, we received the first version of the HTTP Archive as an additional feature, this is what the Network tab in DevTools is today, a place to store each and every request made inside the inspected browser tab. By 2010, a Lite version of the extension has been ported to Google Chrome as a bookmarklet.
In 2011, there was a boom of Firebug extensions that contributed to making the extension even more popular than before. And, ultimately, in 2016 and 2017, the extension makers united with the folks at Mozilla to create what we now know as DevTools. In 2017 the extension itself was discontinued because DevTools was built directly into the Mozilla browser, therefore there wasn’t any need of an extra extension.
Alternative: DevTools
While Firefox was slowly but surely adopting this extension as a new component of itself, Chrome was working on something similar as well. They were actually the ones calling it DevTools. This is part of Chromium, the group that develops Google Chrome and Chrome OS.
While this is open to debate, I believe that DevTools in Chrome is more advanced than the Firefox version. I say that mainly because it offers more features. Developers can create a complete profile of how a website behaves in terms of JavaScript.
We’re going to talk more about specific features in a moment. For now, it’s worth noting that there are 2 big players out there that are trying to achieve a similar result.
Components
For the rest of this article, for the sake of simplicity, we’re going to focus on Chrome’s DevTools.
The Inspector
Every time you right-click on an element in an HTML page and click “Inspect Element”, that’s what will pop up. That’s DevTools with the Inspector feature focused.
The Inspector is based on the initial concept introduced by Firebug, editing HTML and CSS. However, there are a lot more really helpful features in this area that are worth noting.
The HTML Editor
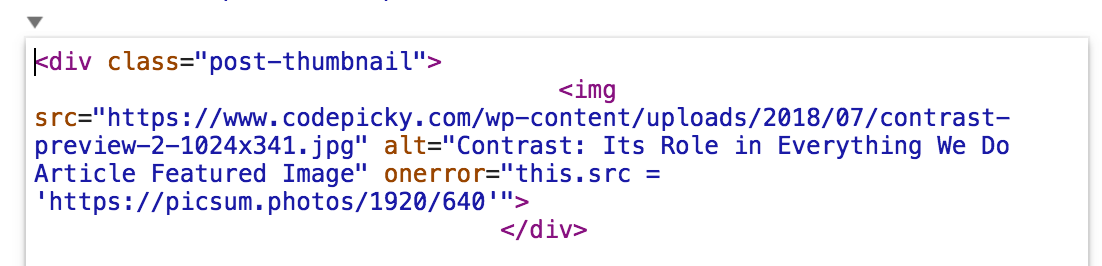
The page’s source code is neatly presented in an editable tree-based manner. It’s important to note here that this is exactly how Chrome itself interprets a page. It’s a ‘beautified’ version of the source code. That is to say, if you forget a closing </div>, for example, the browser has a way of knowing that, and it doesn’t fail to load the page, it just falls back on some alternative. Hence, in the Inspector itself, Chrome displays this as it interprets it, not how it was written.
Everything in the presented HTML code is editable when you double-click it. You can edit any element’s tag name and attributes. If you right-click on a tag, you will see a menu similar to this:
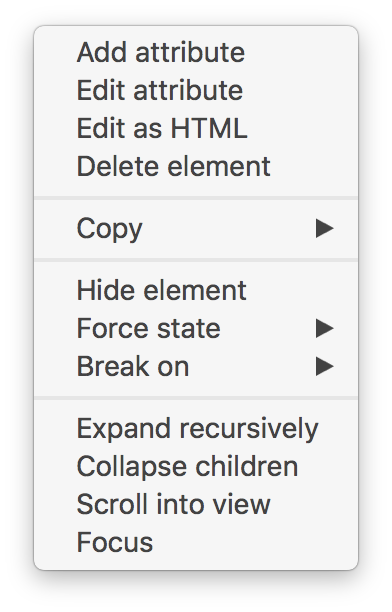
Add attribute allows you to add a new attribute to the selected element. This is not restricted to recognized HTML attributes, you can add data-attributes or completely random ones too.

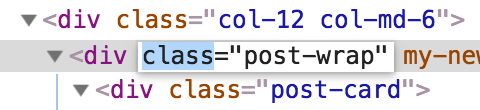
Edit attribute has the same effect as double-clicking an attribute. You can change its name, its value or both.
Edit as HTML allows you to edit the entire element, including its children, just as you would in a code editor.
Delete element allows you to remove the element from the HTML source. You will immediately see it reflected in the viewport.
You can use the options inside the Copy sub-menu to copy different aspects of the element. You can copy its XPath selector, the contents, itself, and so on.
Hide element adds a class defined inside the DevTools itself. It applies visibility: hidden !important via CSS to the selected element.
Force state is something very useful when you want to debug a CSS state. It supports the following states: :active, :hover, :focus, :visited, :focus-within.
If you choose one of them, it will trigger and hold that state on the element for you to do as you please.
Break on will stop JavaScript execution when the selected element reaches a breakpoint. You can define said breakpoint from this sub-menu. It supports subtree modifications (when a child gets modified), attribute modifications, and node removal (a node is a tag in this case).
Expand recursively simply expands all the children of the element. This is useful in situations where you’re searching for something in particular under a node.
Collapse children has the opposite effect as the previous option.
Scroll into view will make the browser window scroll until it reaches the selected element.
Focus is pretty self-explanatory, it will focus the element.
Apart from all of these useful options, at the bottom, there is a breadcrumbs-type navigation which you can use to quickly jump to parts of the selected element.
You can also search through the HTML source code by pressing CMD + F (CTRL + F on Windows)
The CSS editor
On the right-hand side of the Inspector, you’ll find a CSS editor. This follows the same basic principles as the HTML editor. Meaning that you can edit anything by double-clicking. Here, the CSS properties and values also have auto-complete. But even if you mistake the name of a property, it will let you know by displaying stroke by a line.
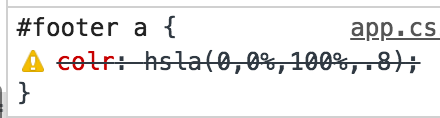
In that case, I wrote colr instead of color, which is an invalid option. If we hover over the warning icon, it will let us know what’s wrong with the property.
The properties displayed in this section are all the properties that affect in any way the selected element. Also, any property that overlaps another, will be cut out to let you know that it has been ignored, in favor of another. This is particularly useful when you write a CSS selector that is not explicit enough.
For example, if you have the following CSS rule:
#content p {
    margin: 15px 0;
}
If you try to style p elements again, with the following code:
p {
    margin: 5px 0;
}
This will show up cut out in the CSS editor, because p doesn’t take precedence over #content p.
You can tell how useful this feature is if you think about the times you tried to debug CSS without it. That wasn’t fun, was it?
Apart from this, there are all kinds of useful features here that make your life a little bit easier. Like the fact that you can check every color with a color picker and see the change directly in the browser, or the fact that you can increase and decrease CSS values with the arrows.
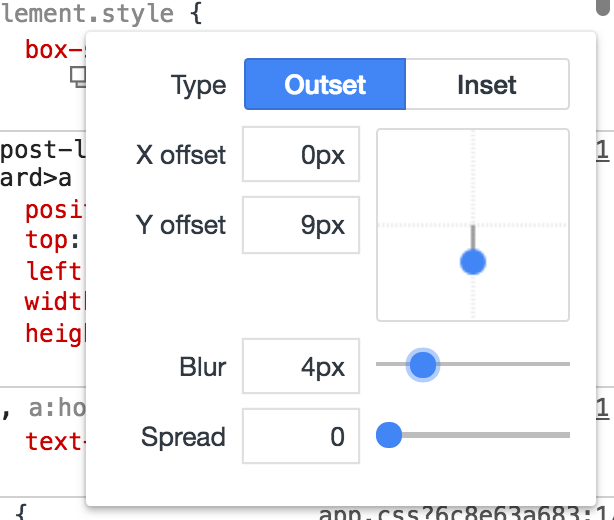
You can even inspect shadows and redefine them with a simple GUI:
I encourage you to start playing with it if you haven’t already. You’ll be amazed.
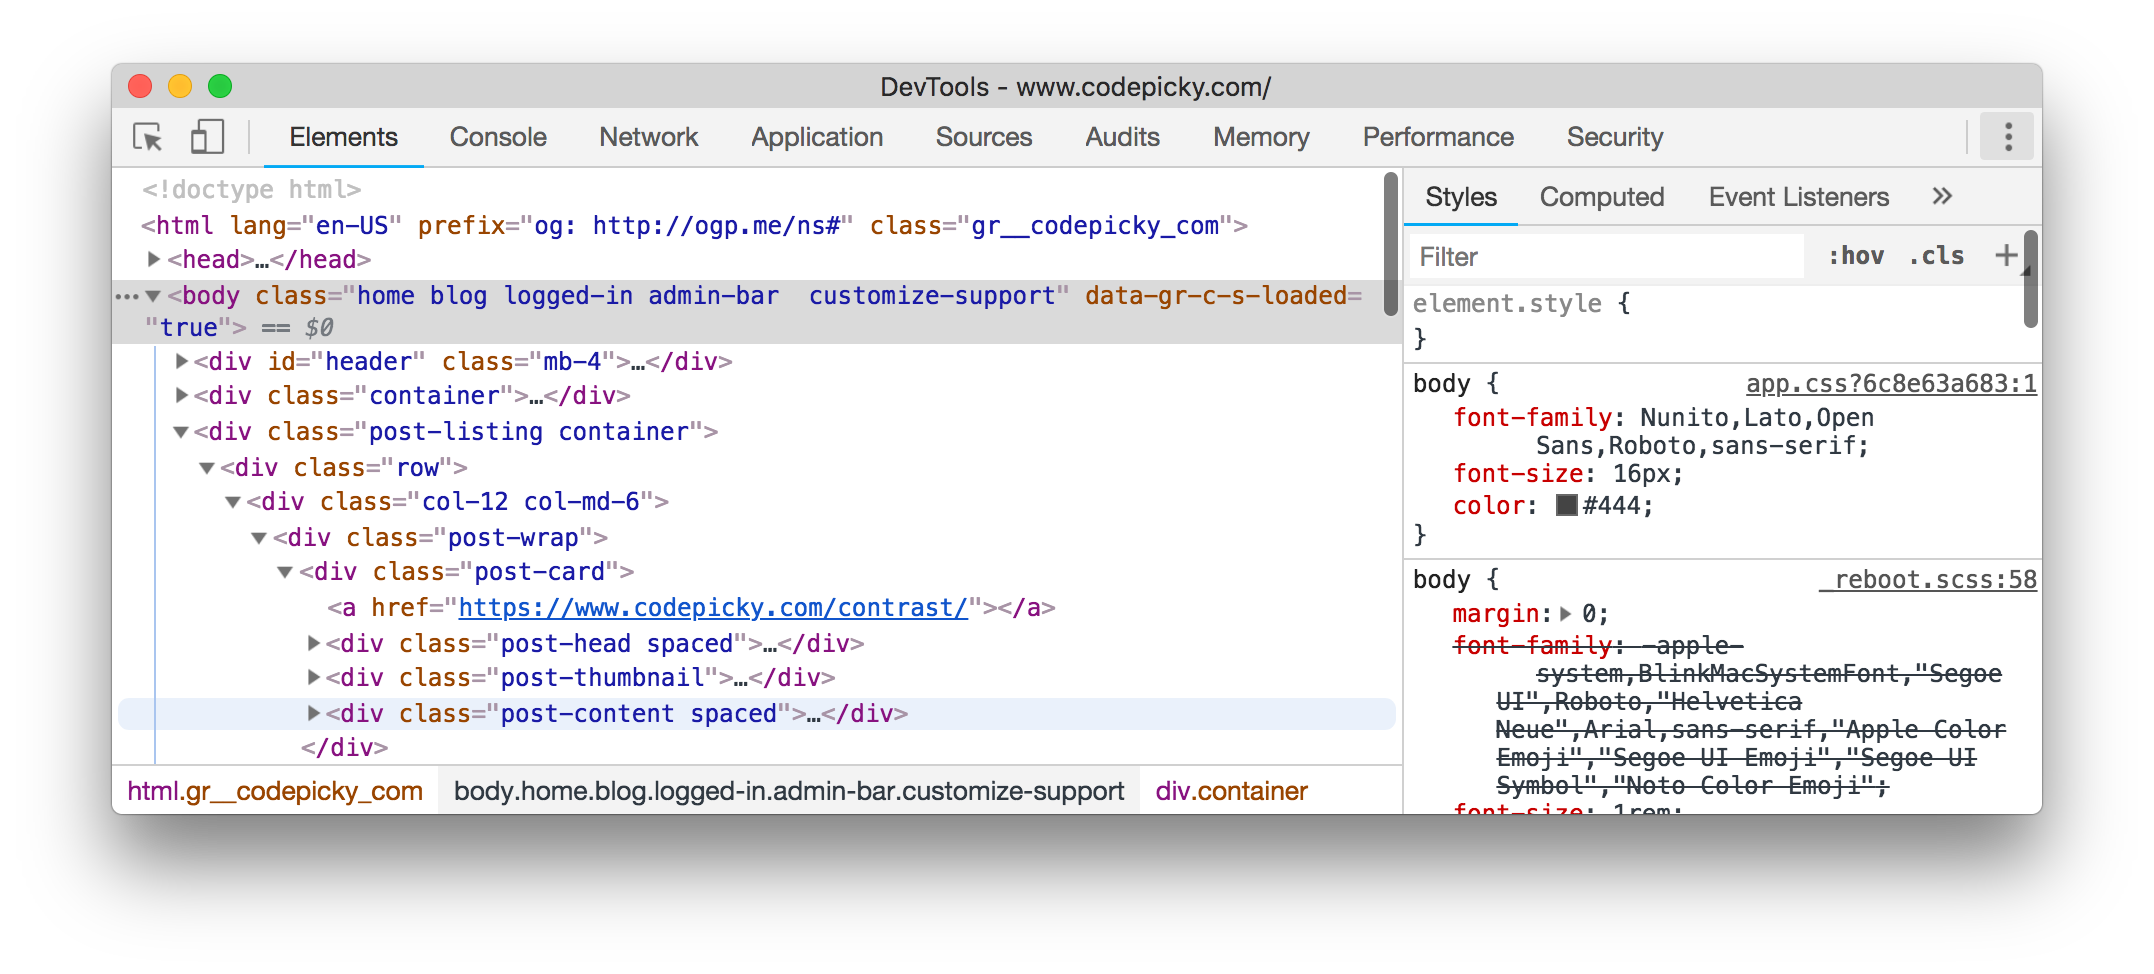
Apart from the Styles section of the CSS editor, there’s also a Computed section, which lists all the properties that have been applied to the selected element. Basically, everything that has a different style than the default Chrome style. Also, if you hover over any of the listed properties, an arrow will pop up. Clicking the arrow will get you to the precise CSS selector that styled that element. This is again something very useful when you want to debug CSS. I find myself using this very often when I want to find out what font a web page is using. Selecting any text element and going to the Computed area, I can find the font-family very easily.
![]()
The Console
The Console section of DevTools is probably one of the most important for JavaScript developers. You can use it to write debugging information to it, execute arbitrary JS code, or debug requests that failed in errors.
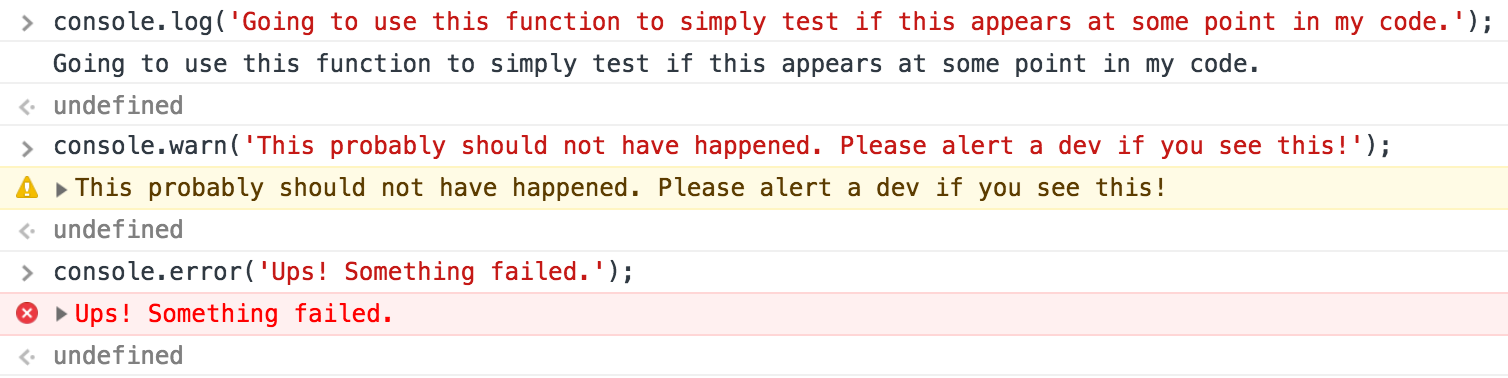
Writing to the console is as easy as typing console.log('Test') anywhere in your code. The console object also supports the warn(), error(), and debug() functions. The only difference between them is the way they’re displayed.
The Console logs all the errors that appear during the request of the inspected tab, including failing HTTP requests and any missing media files (fonts, images, scripts, styles, etc). That’s why this is an indispensable tool from a JS developer’s environment.
If you want to test some JS code on any website, simply fire up the console and start typing. It’s that simple. It’s powered by the same engine that powers node.js, Chrome’s V8.
It also has history, meaning that even if you close a tab, you can access your previous code in any other tab or window.
It supports autocomplete, which is great if you’re looking for an already defined variable. Or even if you just want to browse through the window object.
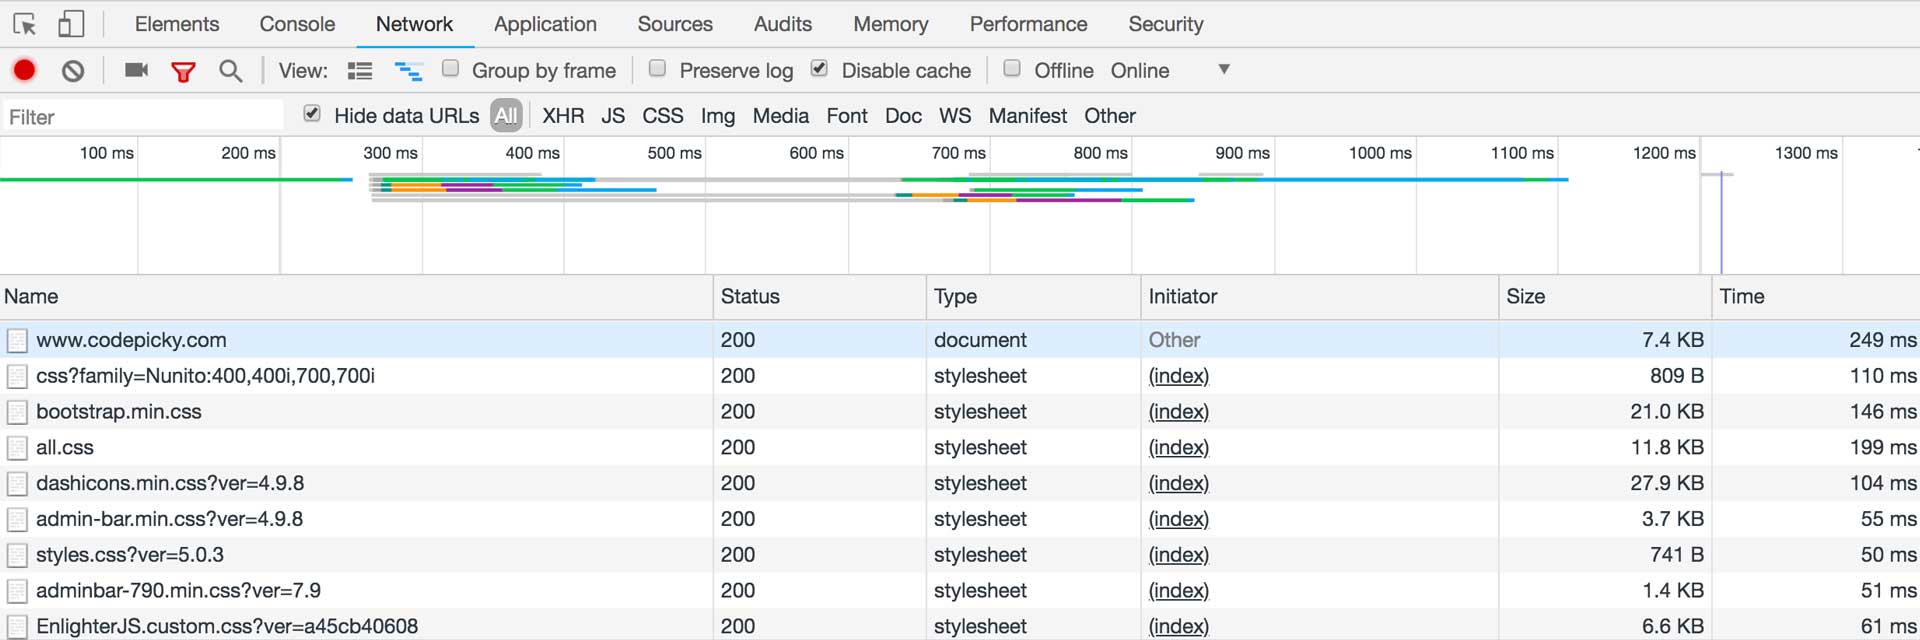
Network
This area records all the HTTP activity within the current tab.
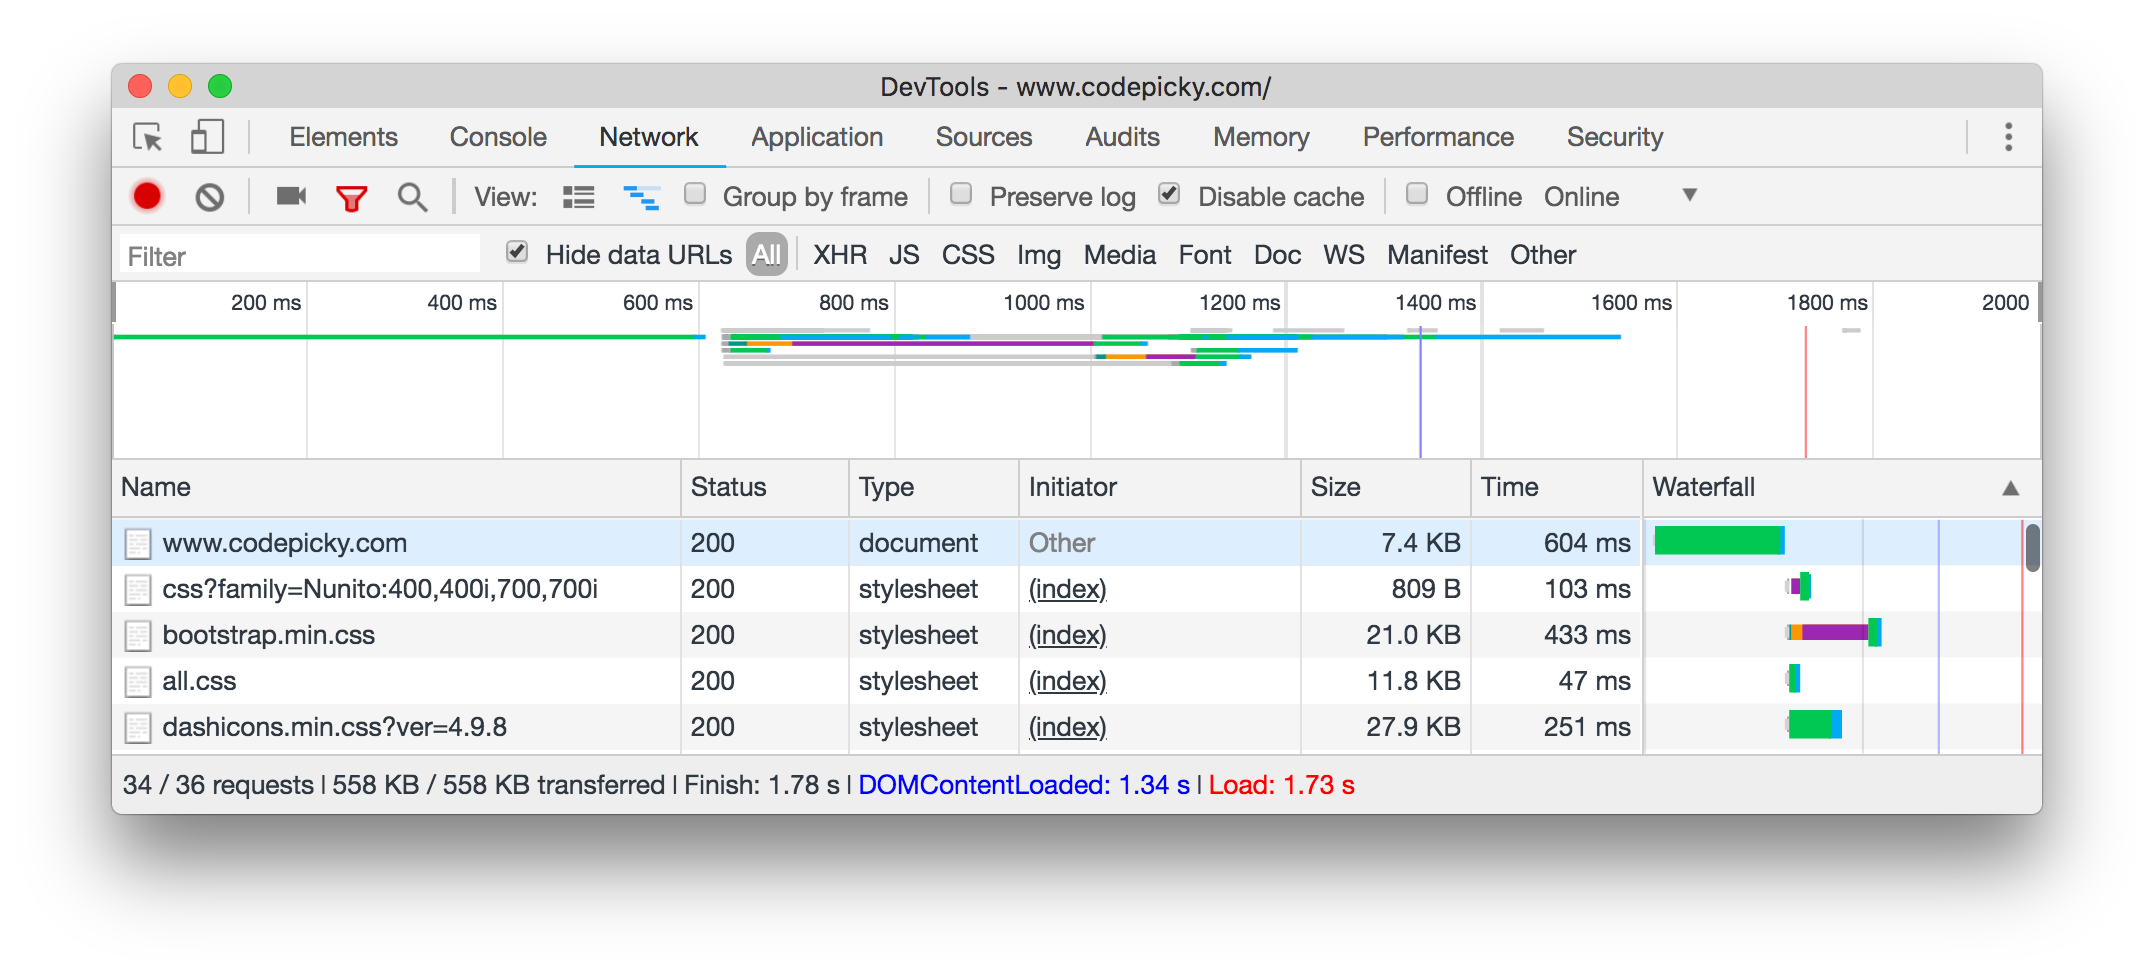
There’s a lot of information in this area, but you will only be using a few key places.
First, let’s start by simplifying the interface a bit. Click on the blue icon at the top, second after “View:”, to hide the Timeline.
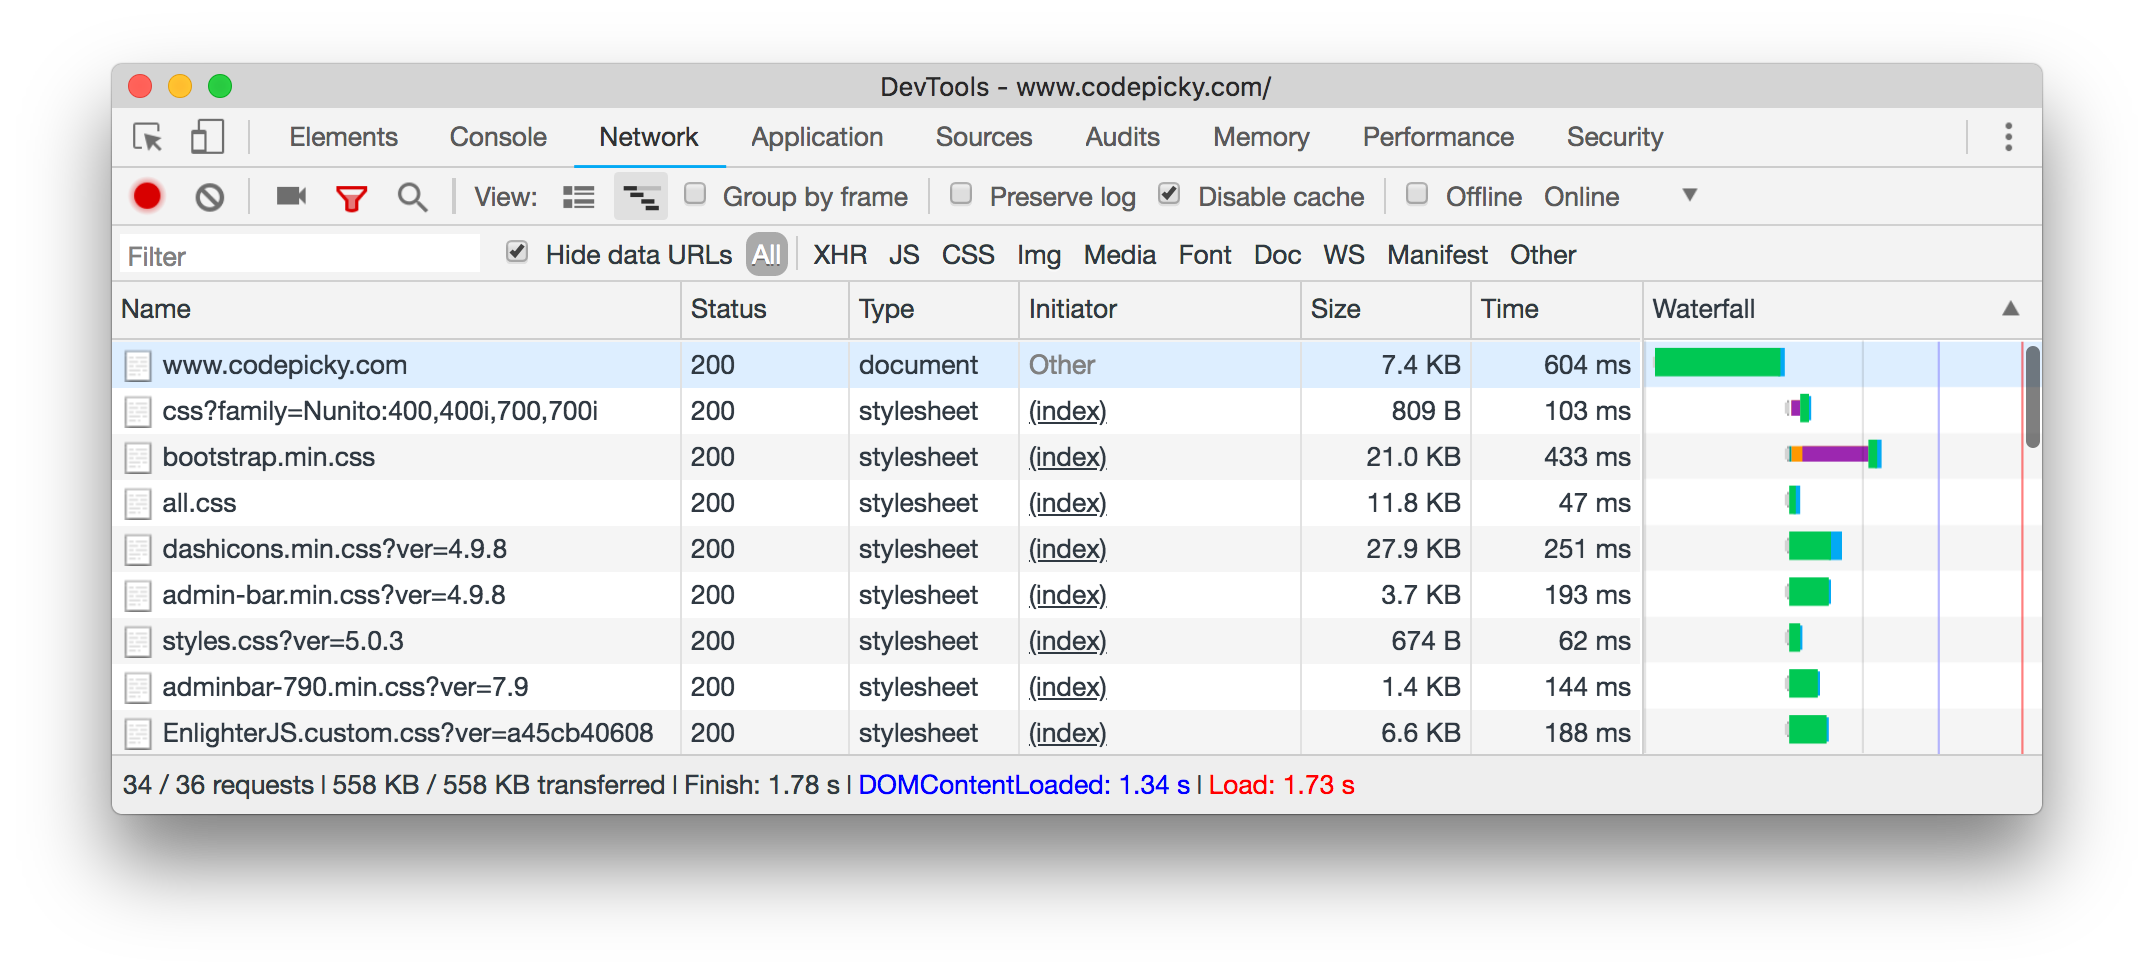
If we click any of the requests, we can open a different view dedicated to that request.
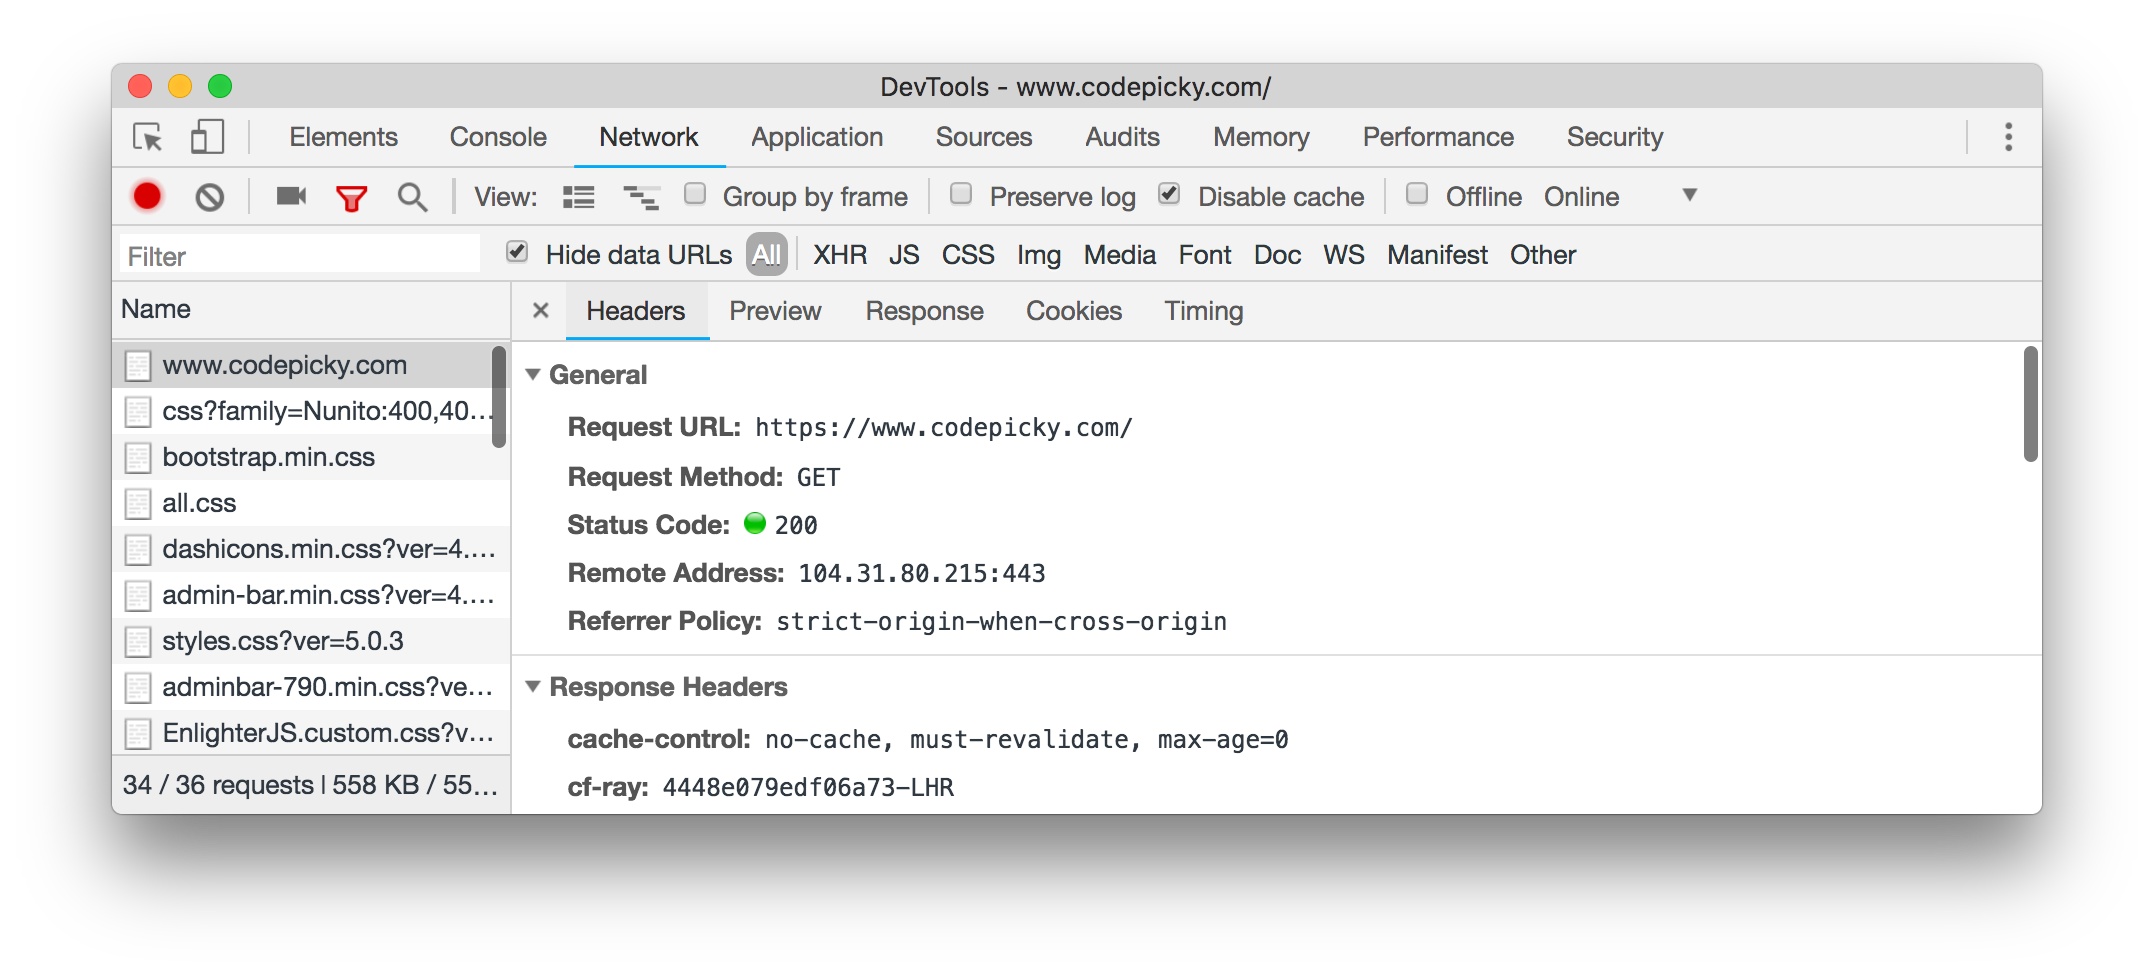
This allows us to inspect the request’s Response & Request HTTP Headers, see the method used (GET, POST, PUT, etc), see the status code, and even the remote address (site’s address).
In the Preview section, we get exactly what we get in our browser window if we visit that request individually.
Response displays the RAW response code, similar to view-source.
The Cookies section displays all the request & response cookies associated with that specific request if any.
Timing displays some useful information about how much different parts of the request took to load.
The Network section is very useful for API developers. Do you want to know what your request responded? What content-type had it specified? You’ll find your answers here.
Above the request list, there are a bunch of options to filter them. You can filter by file name, or you can filter by type. For example, XHR limits the list to AJAX calls only.
Above the filter, there are a few more options which allow you to disable the page’s cache while the DevTools window is open. This is particularly important for devs because cache can be a real issue when constantly updating components and want to see the changes happen instantly.
The Preserve logs option allows you to make the list of logs persistent from one request to another. Because, by default, the network list of requests is cleared after a hard page refresh.
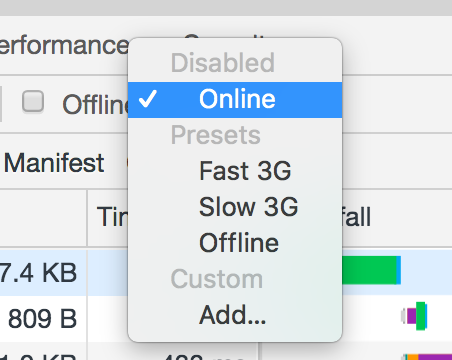
One other very useful option is the select at the end, which allows you to throttle your internet connection to that tab. This way you can see how your page will behave on slow internet connections.
Application
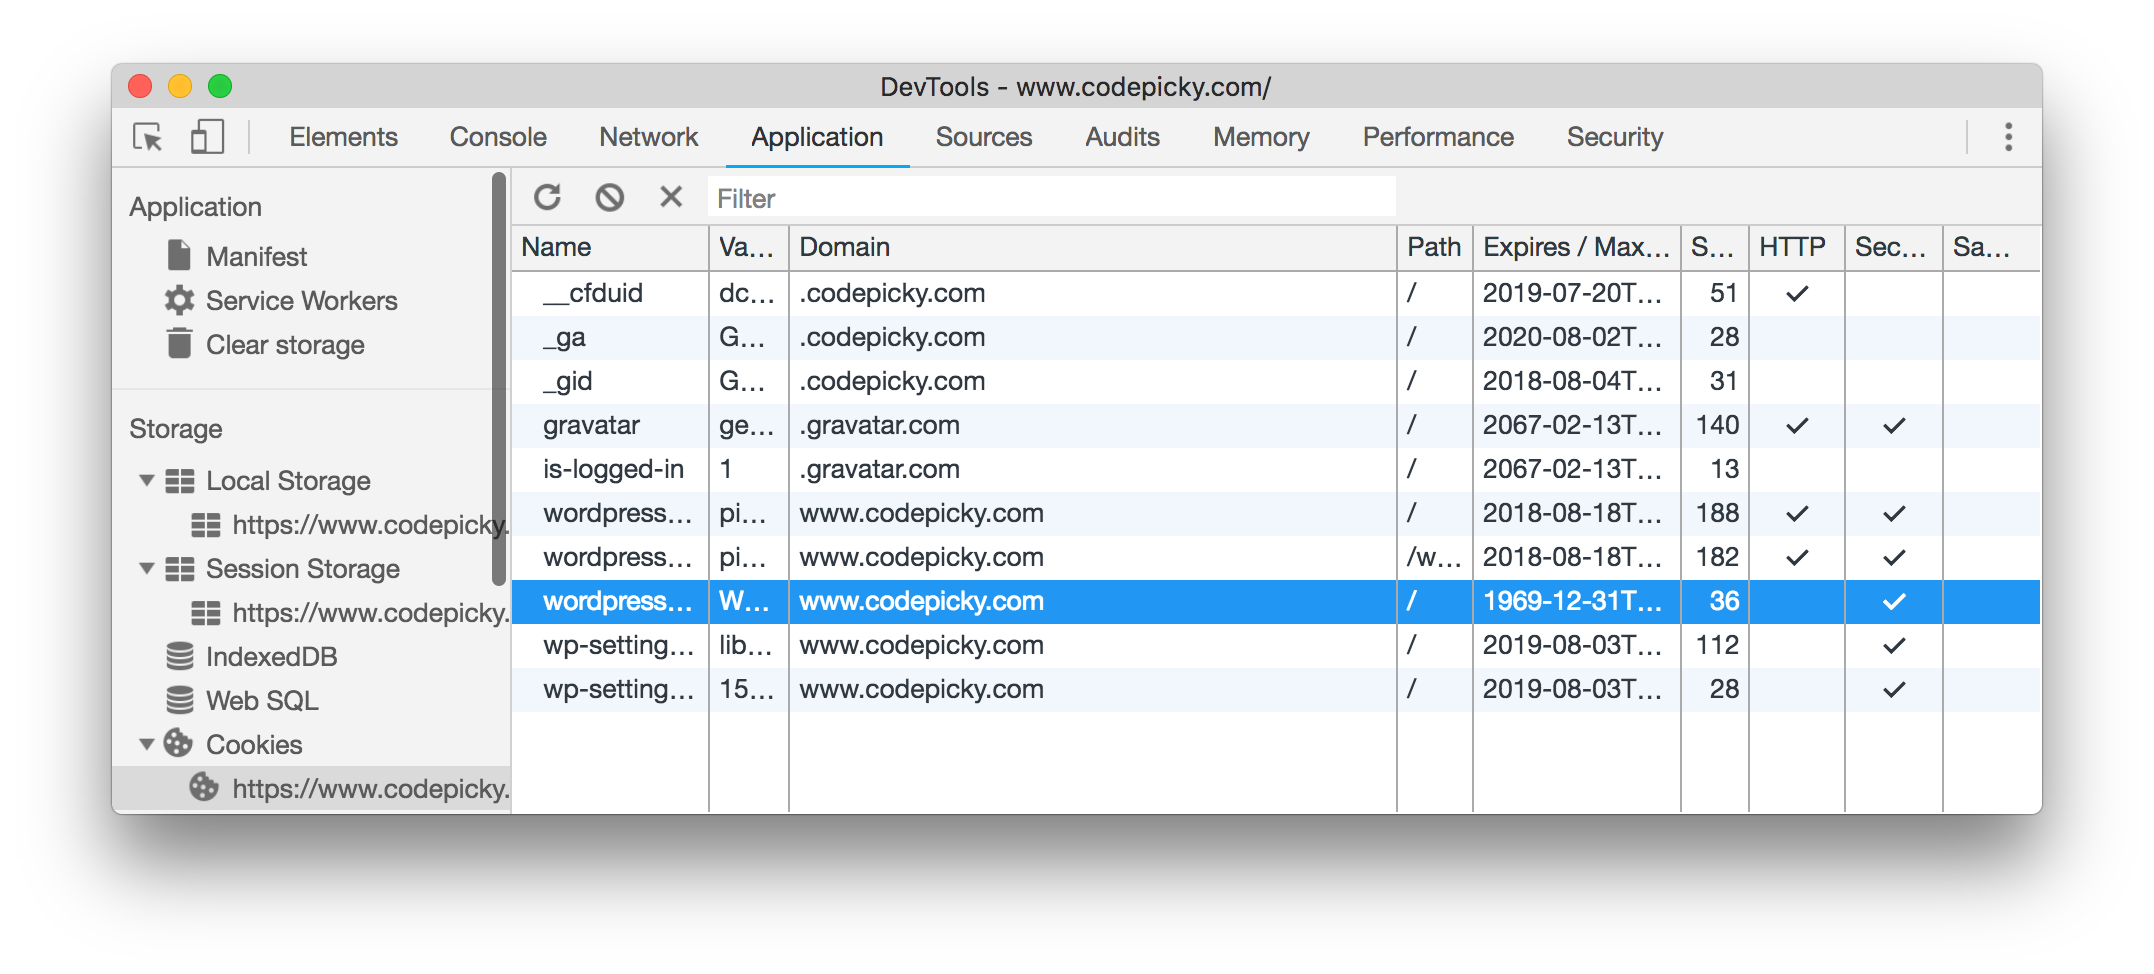
The Application section of DevTools contains all the data stored on your computer by websites. You can see how much it takes up on your computer, or edit every cookie, localStorage / sessionStorage record you want. Double click a value to change its contents.
Conclusion
Although we didn’t cover all sections yet, you can see how the Chrome DevTools is a valuable resource in the life of a Web Developer. The rest of the sections will be covered in a future article, which will cover the advanced components.
Until then, I encourage you to start experimenting with the DevTools, because you have nothing to lose and everything to gain.
P.S. For those of you that love shortcuts, here’s a cheat sheet of the entire DevTools.